Sage 300 Report Spotlight – The Financial Trend Analysis Report
Sage Intelligence Reporting (SIR) is a powerful tool for financial statement creation and generation. SIR simplifies the design of financial statements by providing consistent, custom formulas in the familiar world of Excel. In this post, we discuss how to customize “out of the box” SIR reports. First up is the Financial Trend Analysis Report.

You will find the Financial Trend Analysis Report in the Financials folder in Report Manager or Report viewer.

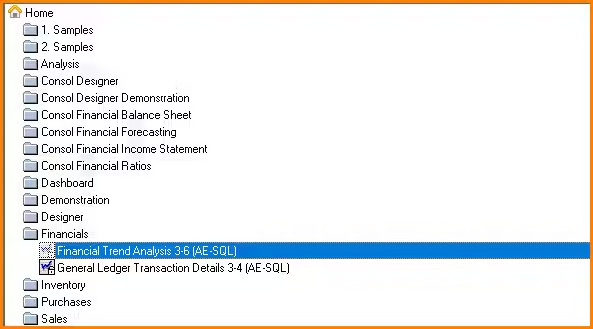
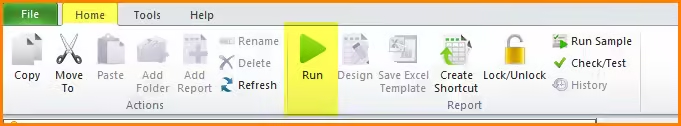
You will notice that there is a little padlock in the lower right corner of the icon signifying that it is a locked report. If we have no need to customize the report, we can leave it as is. Run this report as you would any other by clicking on the Run icon from the ribbon at the top. (Right click menus while parked on the report also have the Run option).

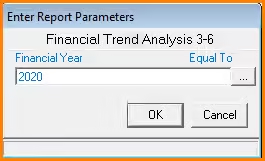
When running the report, you will be prompted to specify the Fiscal Year to be used by the report. Key in the Year you wish or click the 3 dot (…) button to bring up the list to choose from.

When the template has finished generating, you will be presented with the following tab.

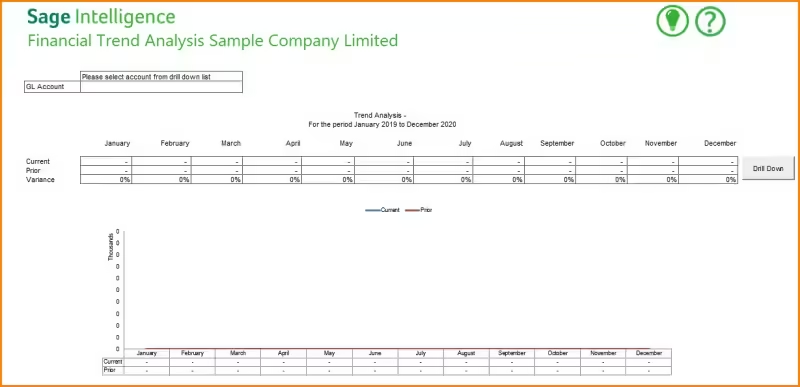
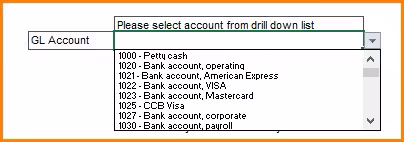
Click in the GL Account selection box, then click the down arrow to browse through the accounts to make your selection.
After making your selection the grid populates with data and plots a comparative graph from the year that you chose when you ran the report and the prior fiscal year.

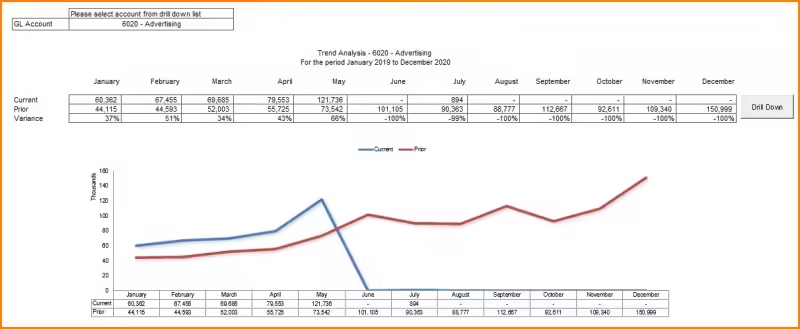
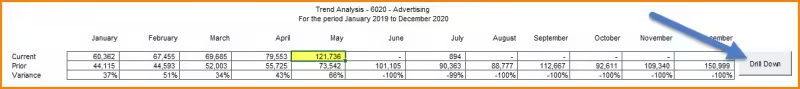
If you would like to see the details behind any of the numbers, simply click on the cell that contains the period you want and click the Drill Down button.
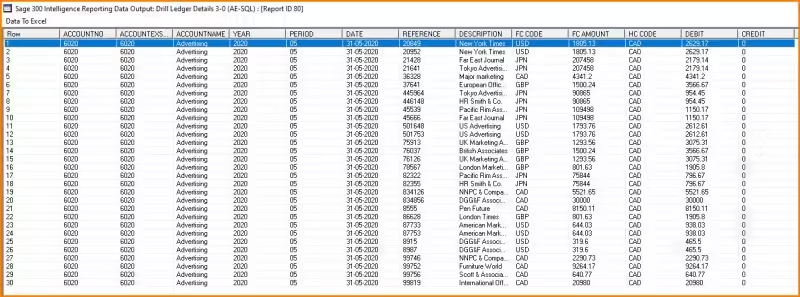
A separate report will generate showing you each transaction that was posted to that GL Account in the chosen period.

When you have finished your review, close the details screen and chose another account to review using the GL Account selector.
Next time we’ll look at how we can customize this report to better suit our needs.